Dashboard Overview
The Vidori Dashboard is your command center for managing your streaming platform. It provides a real-time overview of your content, viewers, and revenue.
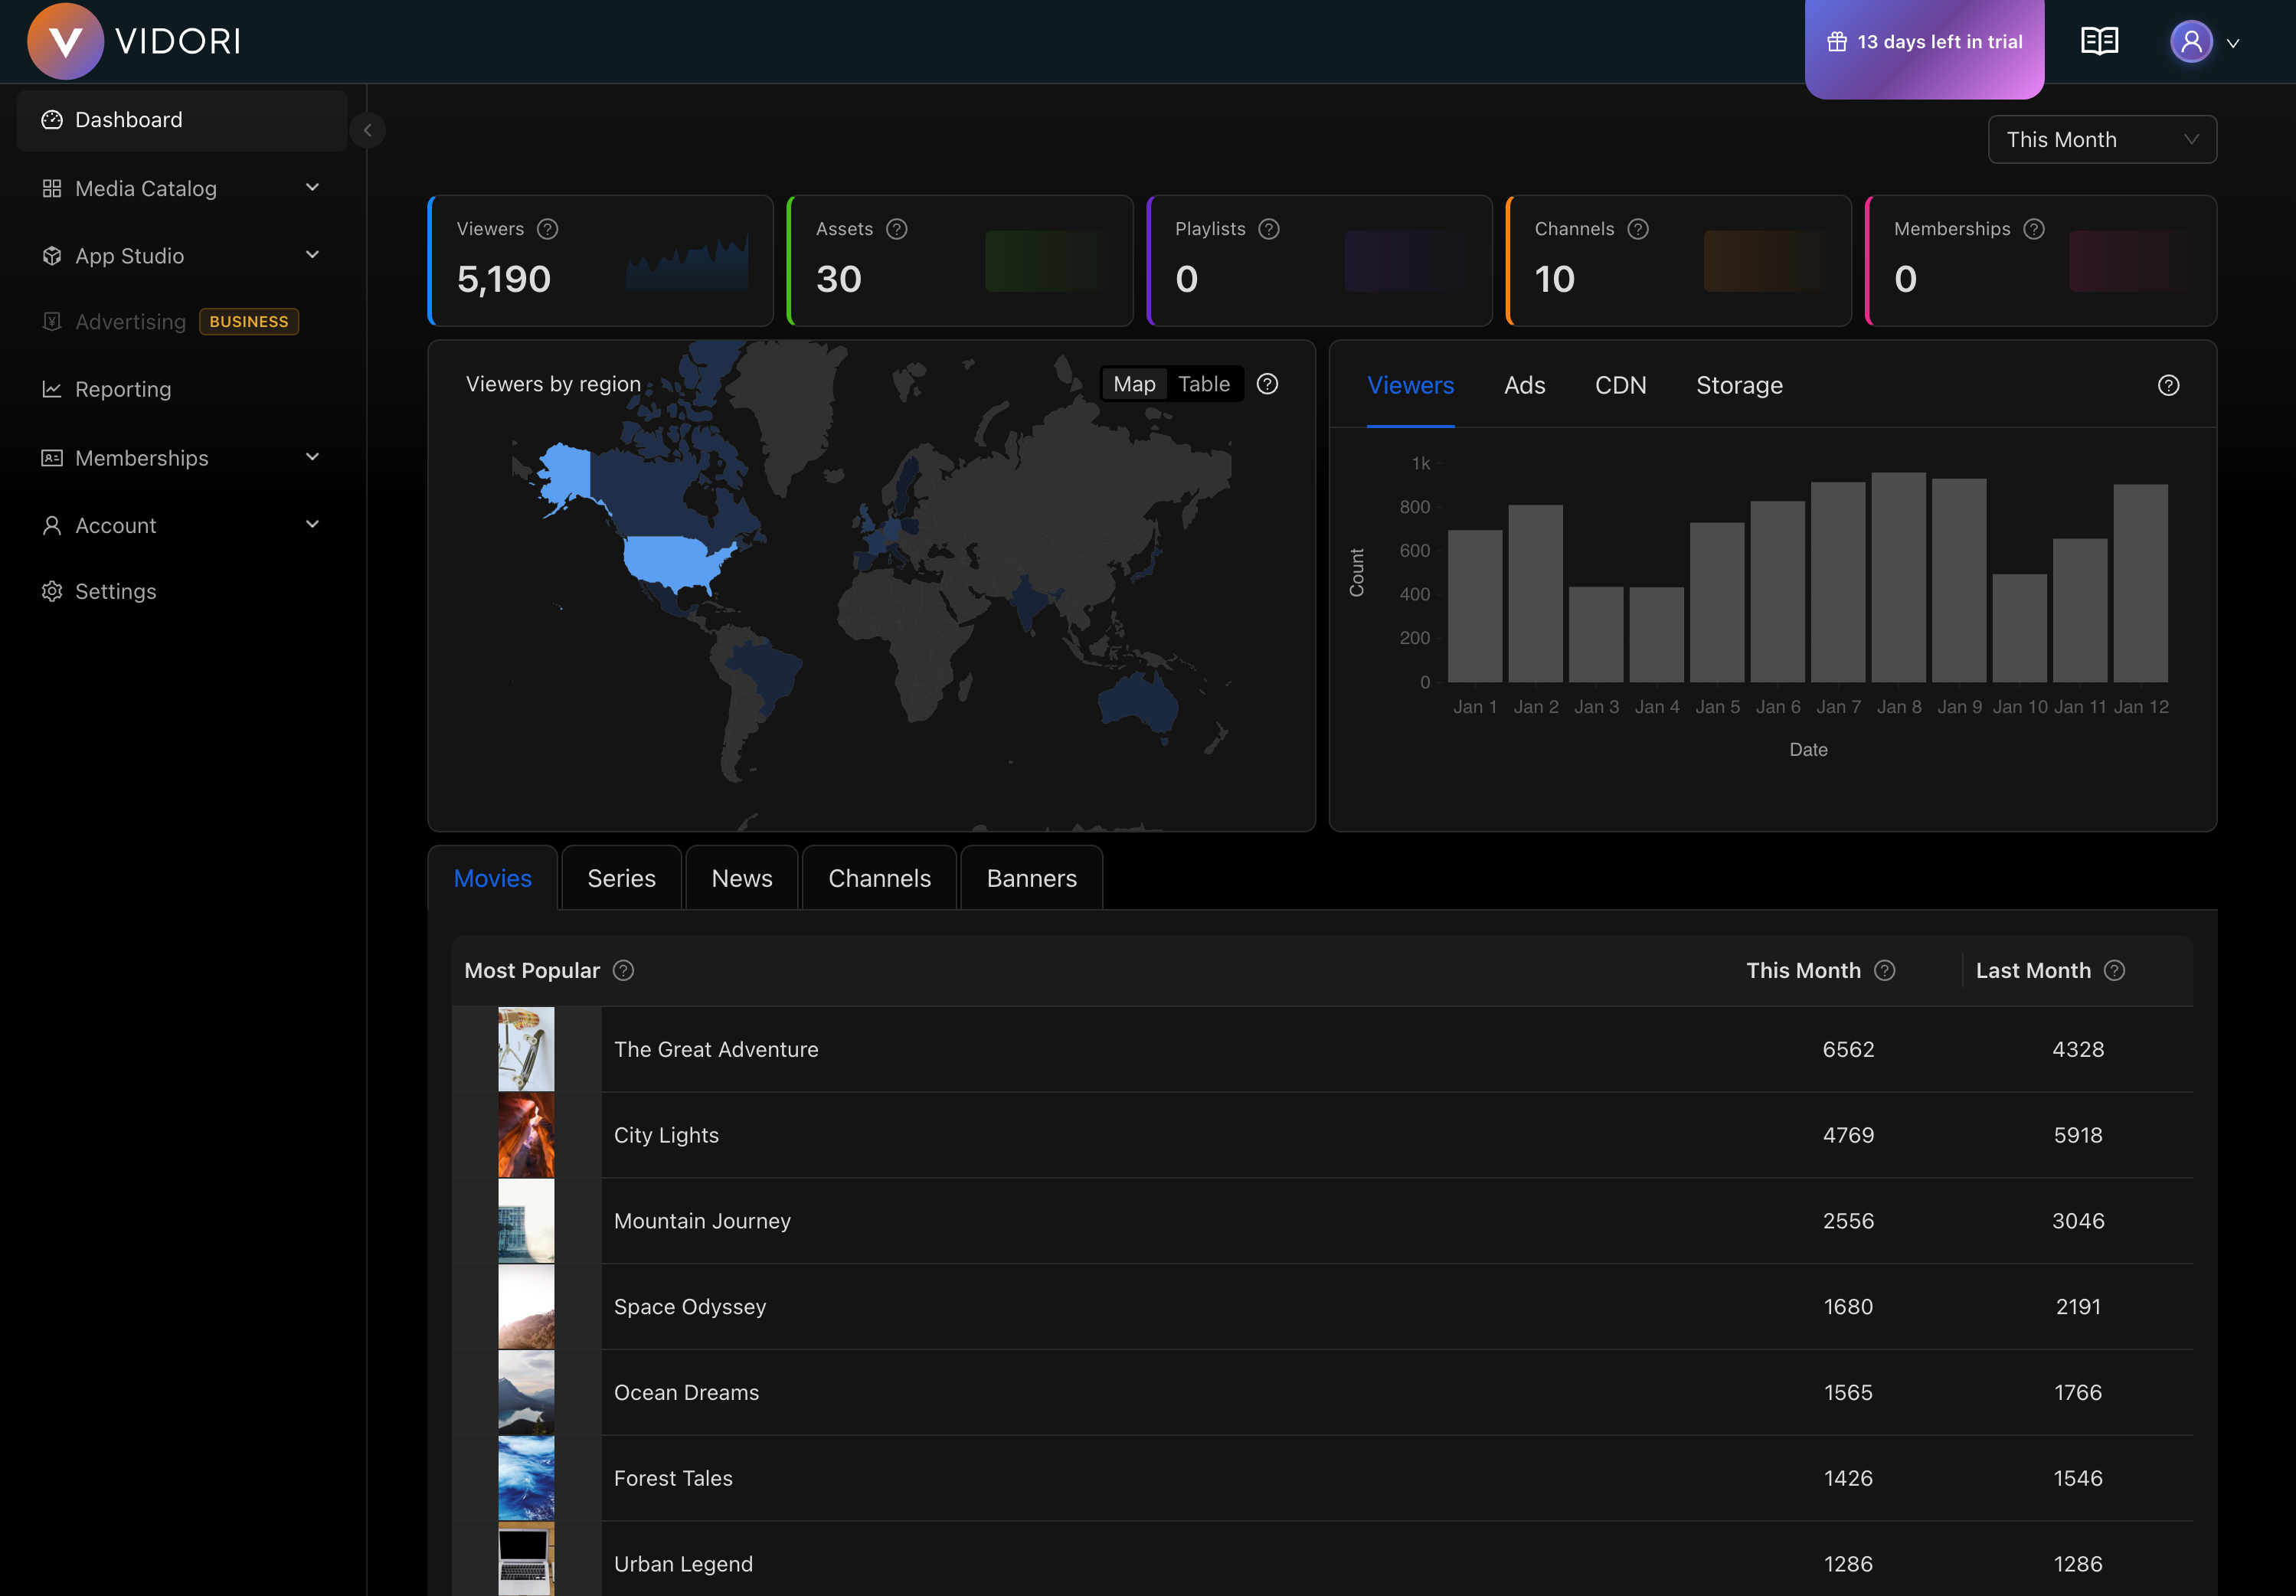
Key Metrics
Section titled “Key Metrics”The top section displays your most important metrics:
- Active Viewers - Current viewers across all platforms
- Total Views (30 days) - Video plays in the last month
- Watch Time - Total hours of content watched
- Revenue - Earnings from subscriptions and ads
Quick Actions
Section titled “Quick Actions”The dashboard provides shortcuts to common tasks:
- Upload new content
- Create a live channel
- View recent analytics
- Manage subscribers
Navigation
Section titled “Navigation”The left sidebar provides access to all Vidori features:
| Section | Description |
|---|---|
| Dashboard | Overview and quick metrics |
| Catalog | Manage all your video content |
| App Studio | Design and customize your apps |
| Monetization | Configure ads and pricing |
| Memberships | Manage subscriber tiers |
| Analytics | Detailed reports and insights |
| Account | Subscription and billing |
| Settings | Platform configuration |
Customizing Your View
Section titled “Customizing Your View”You can customize the dashboard to show the metrics most relevant to you:
- Click the Customize button in the top right
- Drag and drop widgets to rearrange
- Toggle visibility of specific metrics
- Save your layout
Your preferences are saved and will persist across sessions.