Dashboard Overview
The Vidori Dashboard is your command center for managing your streaming platform. It provides a real-time overview of your content, viewers, and revenue.
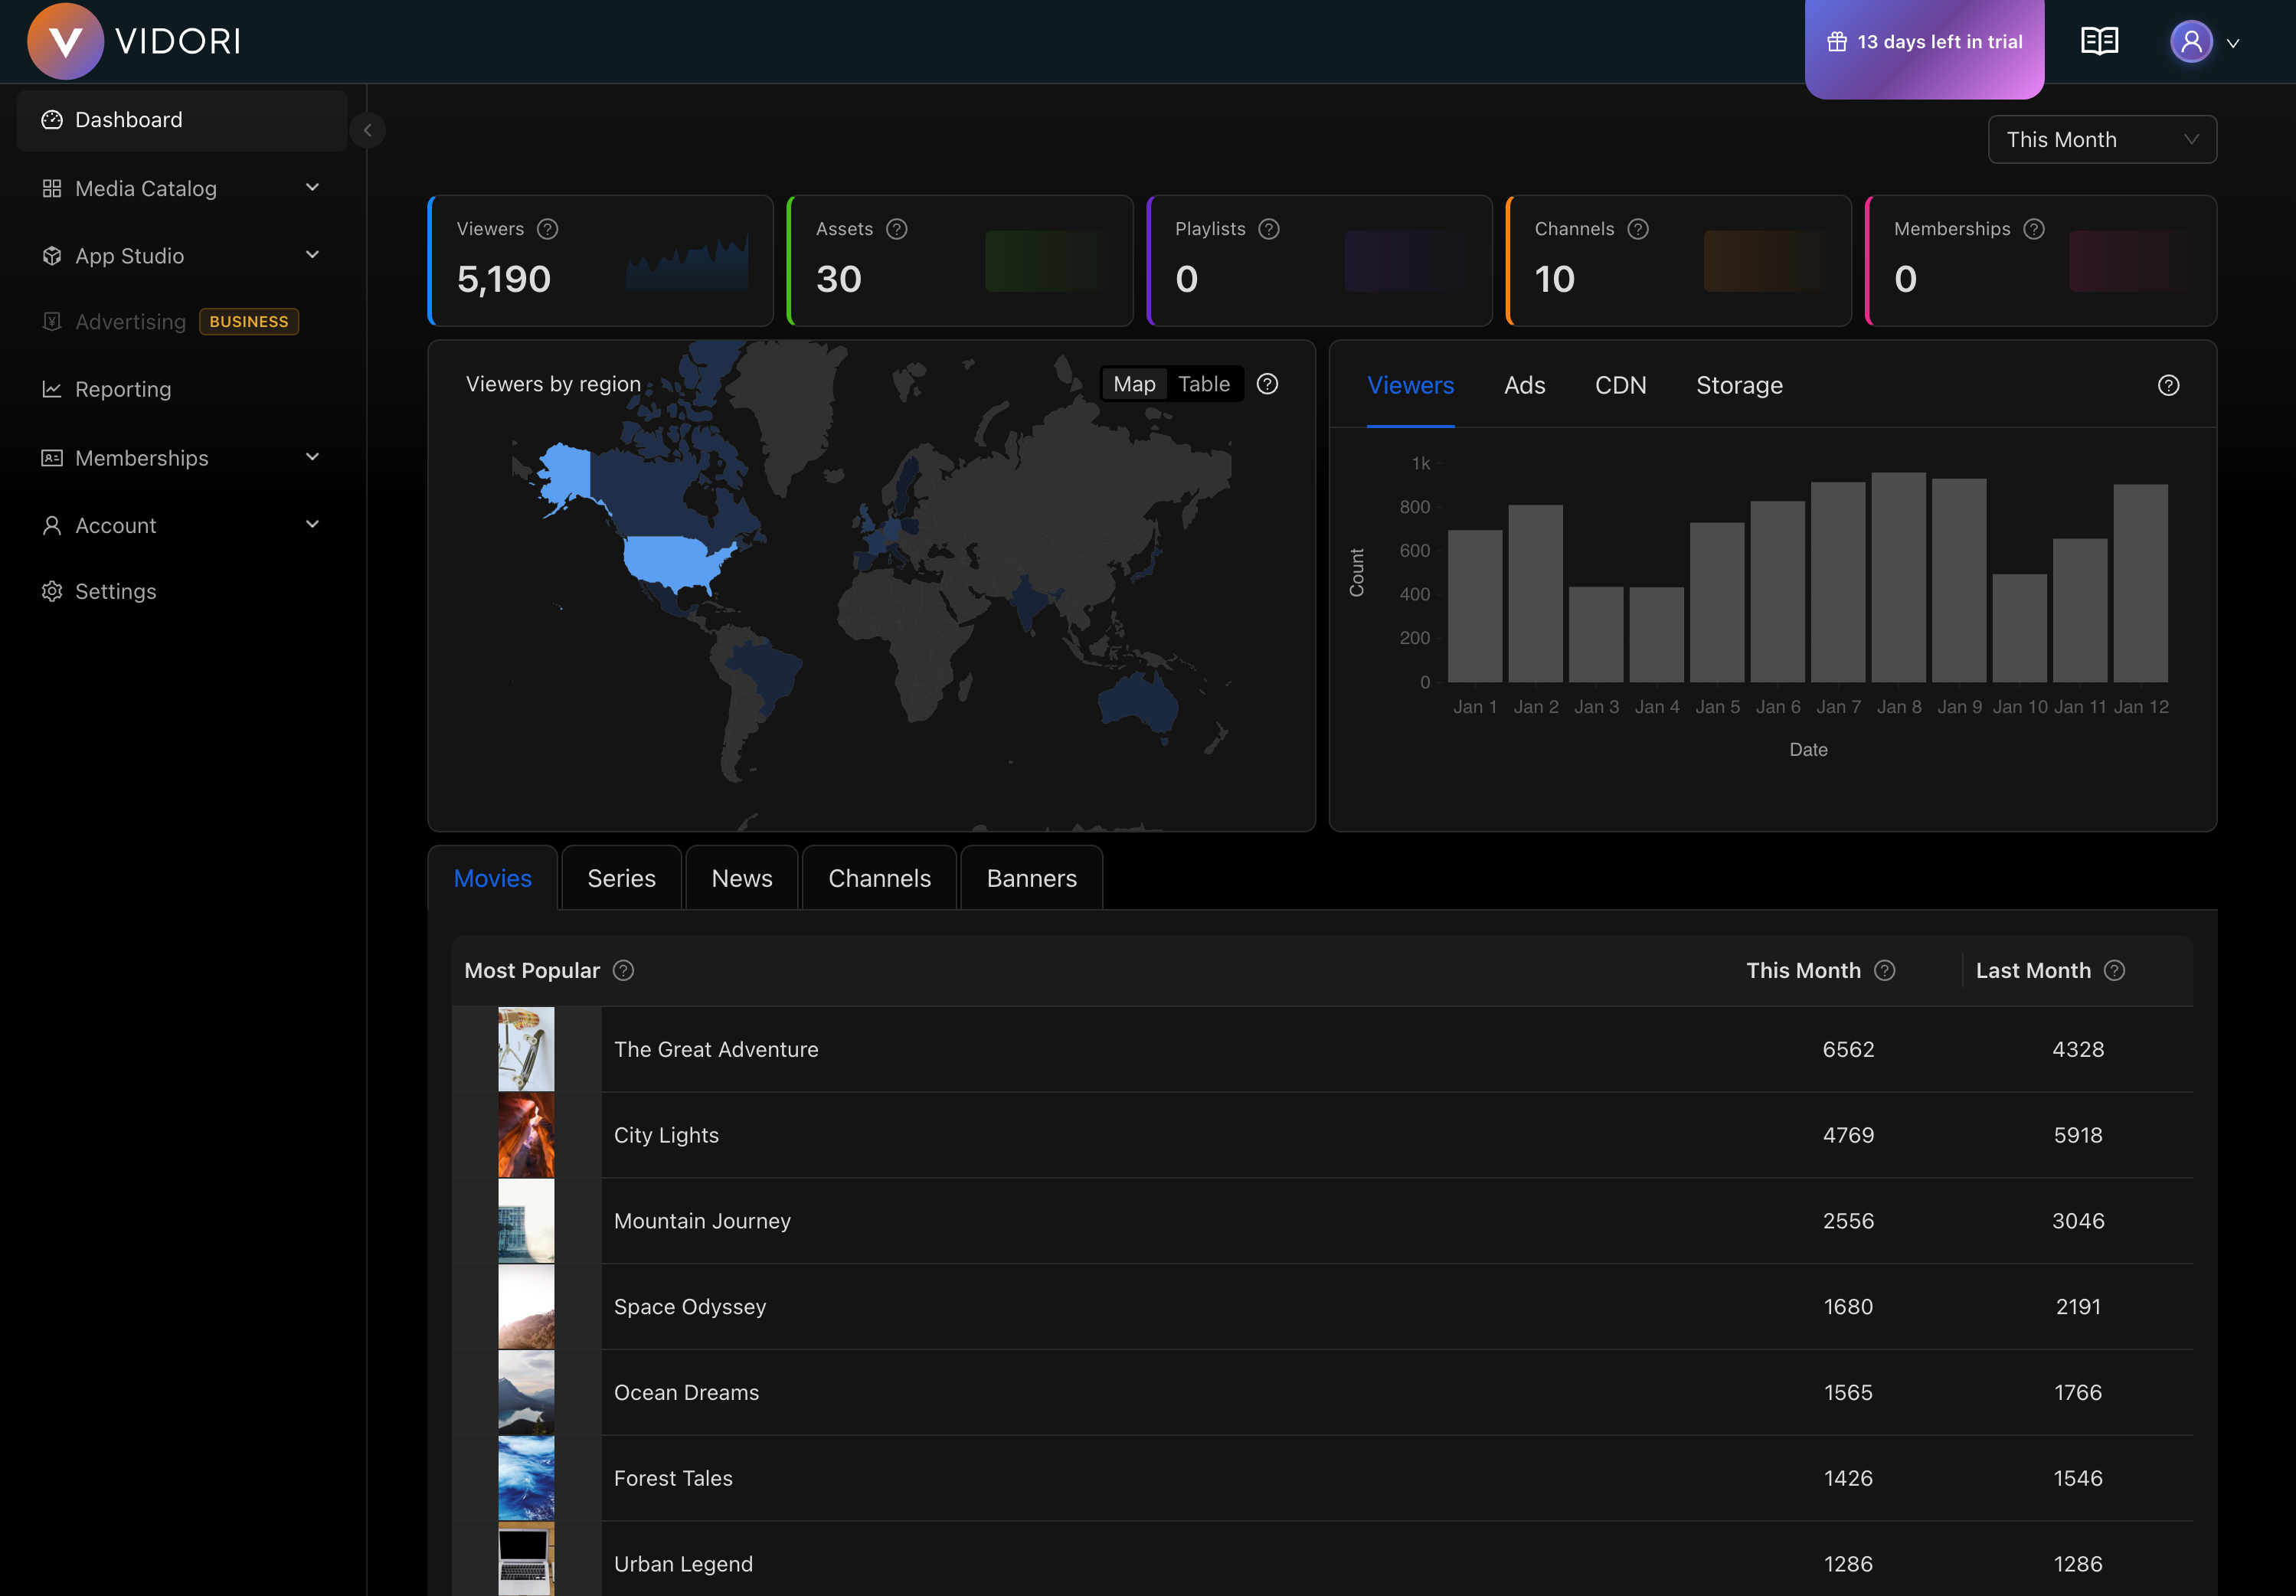
Key Metrics
Section titled “Key Metrics”The top section displays your most important metrics:
- Active Viewers - Current viewers across all platforms
- Total Views (30 days) - Video plays in the last month
- Watch Time - Total hours of content watched
- Revenue - Earnings from subscriptions and ads
Quick Actions
Section titled “Quick Actions”The dashboard provides shortcuts to common tasks:
- Upload new content
- Create a live channel
- View recent analytics
- Manage subscribers
Navigation
Section titled “Navigation”The left sidebar provides access to all Vidori features:
| Section | Description |
|---|---|
| Dashboard | Overview and quick metrics |
| Media Catalog | Manage your content — Import, Channels, Events, On-demand, Groups, Tags, Banners, Playlists |
| App Studio | Design and customize your apps |
| Reporting | Detailed reports and insights |
| Community | Community posts and engagement |
| Memberships | Payments, tiers, entitlements, and identity providers |
Account, Settings, and Monetization options are available from the dropdown menu in the sidebar header.
Customizing Your View
Section titled “Customizing Your View”You can customize the dashboard to show the metrics most relevant to you:
- Click the Customize button in the top right
- Drag and drop widgets to rearrange
- Toggle visibility of specific metrics
- Save your layout
Your preferences are saved and will persist across sessions.